Associations define the future through the exploration, analysis, and visualization of data. This generally involves using existing data to consistently describe key business events like event attendance, member engagement, training course popularity and website traffic. We can tell great stories with this data, but actual language can be the best form of communication. There are a lot of opportunities to use text analytics to help associations make even more confident data-guided decisions.
Taming Big Data
Text analytics is often viewed as within the realm of big data. This makes sense as it generally aligns with the volume, velocity, and variety characteristics commonly used to define big data.
Like other forms of data, text can be used to discover structure, meaning and relationships and provide context to other values. In the case of text, the data shows if a word is in content such as documents, comments and social media posts.
Picture a giant spreadsheet with one column for each of the nearly 10,000 commonly used words in the English language. That’s quite a bit of data for even the savviest Excel user or AMS application. Measures represented by the intersections between the rows and columns might include counts of words in documents and how close words are to one another.
Fortunately, several proven methods exist to make text data much more manageable. They include:
- Removing “stop words” such as “a”, “and”, and “the” that are not likely to be studied.
- Using frequency thresholds that include counts and how unique words are in the content.
- Using stemming to group similar words with different suffixes, like “recommend,” “recommended” and “recommending.”
- Applying the statistical technique of factor analysis that groups words by ideas and themes.

We don’t use these techniques just to address the volume challenges posed by big data. More concise data significantly improves the value of all advanced analytics.
Context is key
Text analytics data is much more valuable in conjunction with other internal and external information like index terms in documents, tags assigned to social content, survey questions accompanying free-form text comments, and characteristics of individuals generating content. Seemingly basic categorizations – like comments tagged as high quality by customers or those made by individuals with a high level of engagement – can significantly impact the analysis and help perform predictive analytics against new data.
You can also provide meaning to text through ontologies, which assign relationships similar to association business processes. For example, an “attendee” is associated with an “event.” They can be defined as part of the text analytics process, or obtained from third-party sources.
The usual models
Once our text is structured in a usable and manageable way, we can apply advanced analytics and statistical methods. We use techniques tailored to this form of data, including categorizing and grouping documents and words. These include:
- Clustering – Grouping things determined to be similar, like words that often occur together or have similar meanings.
- Classification Trees – Assigning documents to a categories based on hierarchical rules. A document with the word “event” might be assigned a more detailed category, like “Detroit” or “annual conference.”
- Graphs – Showing how variables are interconnected and influence one another. These are part of a broader category and are better used for scenarios such as modeling social networks.
There are two ways to categorize these approaches. A supervised approach means the goal is known, like assigning documents to a list of topics. In an unsupervised study, techniques like clustering are used to find similar documents – but without first identifying specific criteria. As with other types of advanced analytics, the modeling process is iterative and requires some manual validation.
What are they saying?
Sentiment analysis of social network content, or looking at positive and negative feelings, is a popular goal of text analytics. Deriving sentiment is more challenging than other applications of text analytics because of nuances in language and difficultly in understanding tone. Many suggested word lists are available to assist.
These two sentences both could indicate a person’s opinion about an event:
- “I really got a lot a great information from this event!”
- “There was much more great information presented at the prior events.”
Another potential pitfall of sentiment analysis is from whom the data comes. Are individuals with negative experiences more likely to voice their opinion that those with positive feedback?
Sentiment analysis underscores the importance of making data-guided decisions, as observations should be investigated and measured over time before drawing definitive conclusions.
Applications for Associations
Associations can gain valuable information from a variety of common business scenarios.
- Social media and collaborative platforms – Assigning categories and other similar comments.
- Event surveys – Understanding specific feedback beyond discrete questions.
- Meeting abstracts – Automatically assigning topics.
- Document similarity – Recommending similar documents and identifying expertise.
- Customer bios – Identifying individual areas of expertise.
- Customer service contacts – Interpreting the reason for the contact.
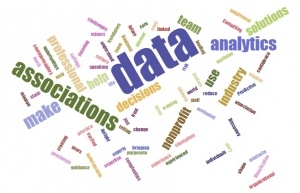
A range of enterprise and other software tools, including the popular (and free) R programming language, are available to implement text analytics. You can also visualize the results of text analytics using leading tools such as Tableau to create visualizations such as heat maps, document clusters, and word clouds.
Your association analytics can include true customer conversations and engagement detail available from text using these approaches and tools that are part of our proven 5 step methodology.