Super Charge Your Data
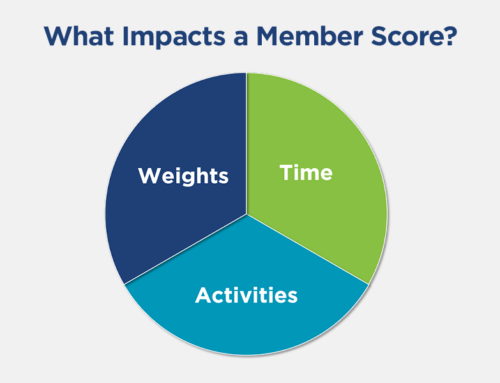
Combining or blending data happens when you connect two or more different data sources. Combining sources from multiple data sources reminds me of one of my son’s favorite shows, Power Rangers. While each one is committed to fighting evil, each Ranger has a unique skill and weapon. When their enemy is too great to handle individually, they combine their unique powers to create a Megazord. A well designed data mart is the ultimate Megazord that can battle the evilness of fragmented information.
Message Activity Analysis
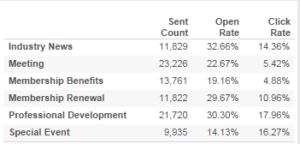
Let me tell you what I mean. Information from your marketing system can be measured and analyzed. You are probably familiar with some common marketing key performance indicators (KPIs) such as number of sent emails, delivery rate, bounce rate, open rate, etc. This is interesting in itself to analyze which messages have higher opens and clicks and which ones are below average.
You might get something that looks like this:
Combine Powers
What makes this information really pop is combining it with your other data sources. Combining the messaging activity data with demographics from your AMS helps you evaluate the influence that things like job level, member type, age and/or gender have on your key messaging metrics.
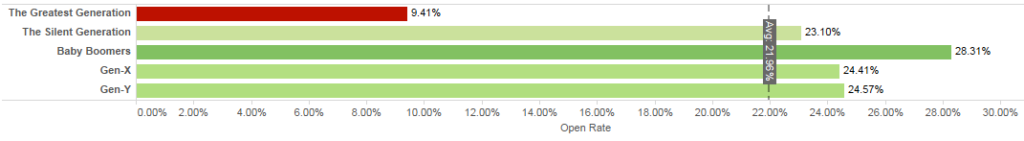
In this example, when we look at Open Rates by generation, we can see that those in “The Greatest Generation” have dramatically lower Open Rates than the other generations. The “Baby Boomers” have the highest open rate. If we were to only look at the average open rates, we might miss this distinction. What actions could you take knowing this information? Perhaps sending an extra mailing to your older members for important communication?
How to Blend Data
Watch this advanced Tableau tutorial to learn how to blend data. For deep analysis and improved performance, we recommend investing in a data warehouses and data marts using a dimensional data model. Learn more about our approach to data blending.